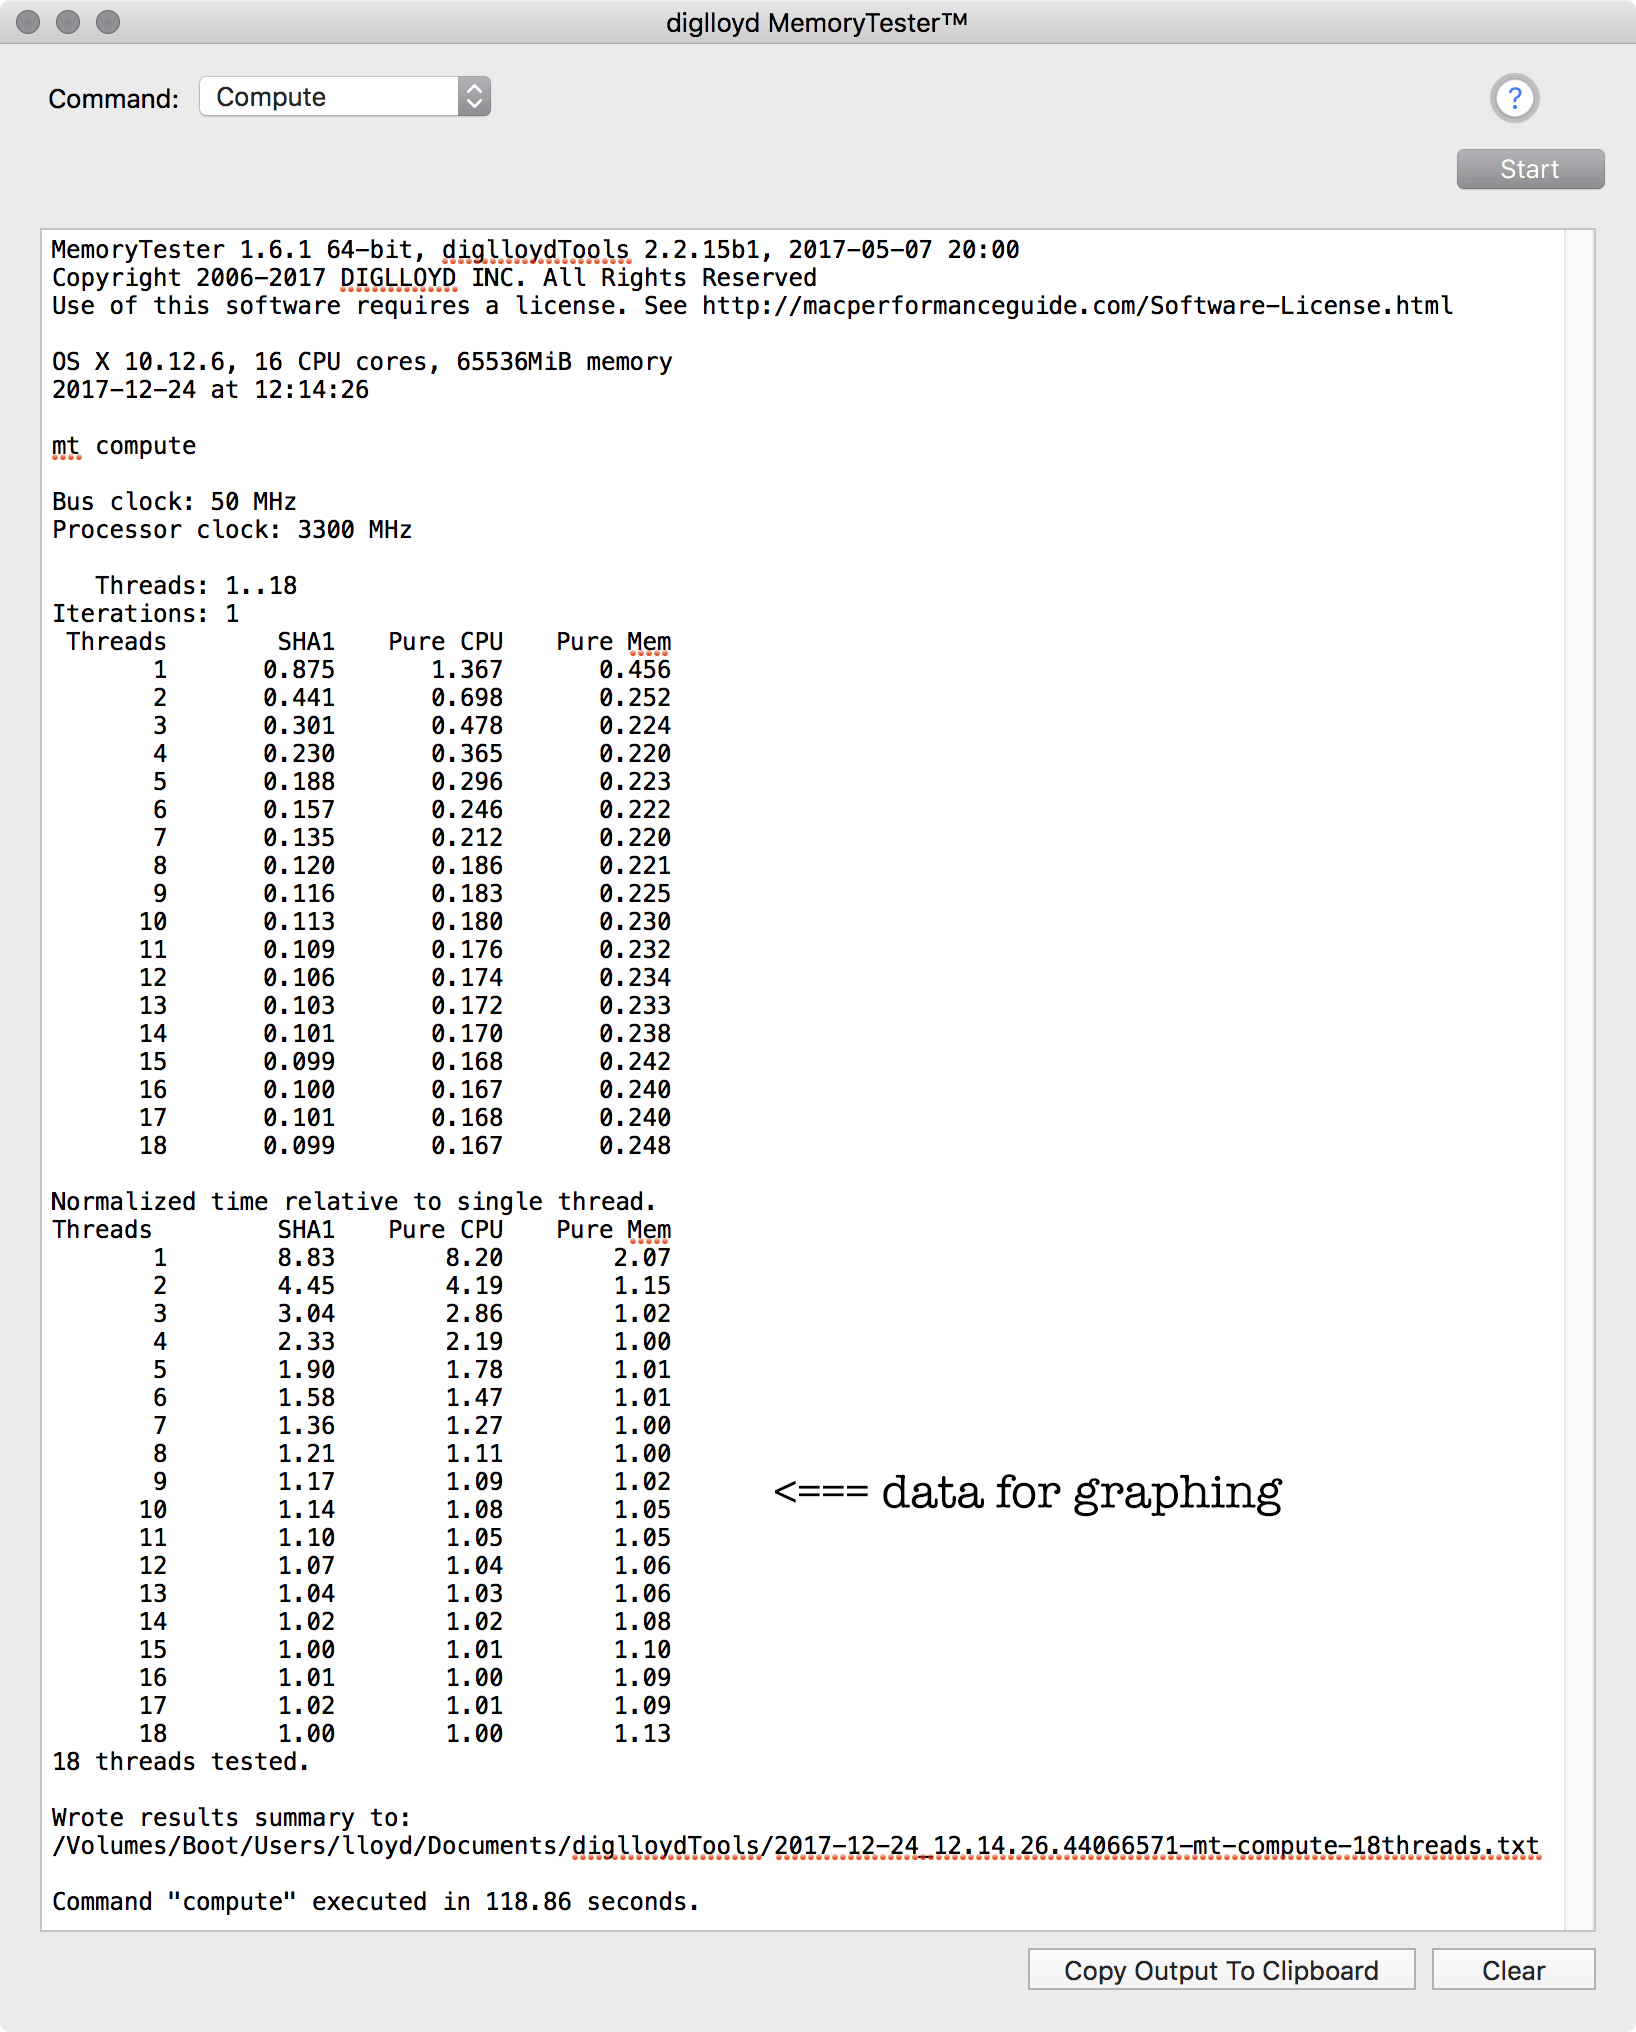
compute
The compute command provides graphable data which shows how well the CPU cores of the machine scale to a multithreaded job.
By default, the compute command uses two more threads than CPU cores, to give a good picture of the scalability up to and slightly beyond the available CPU cores.
Notes:
See below for how to run the compute command.
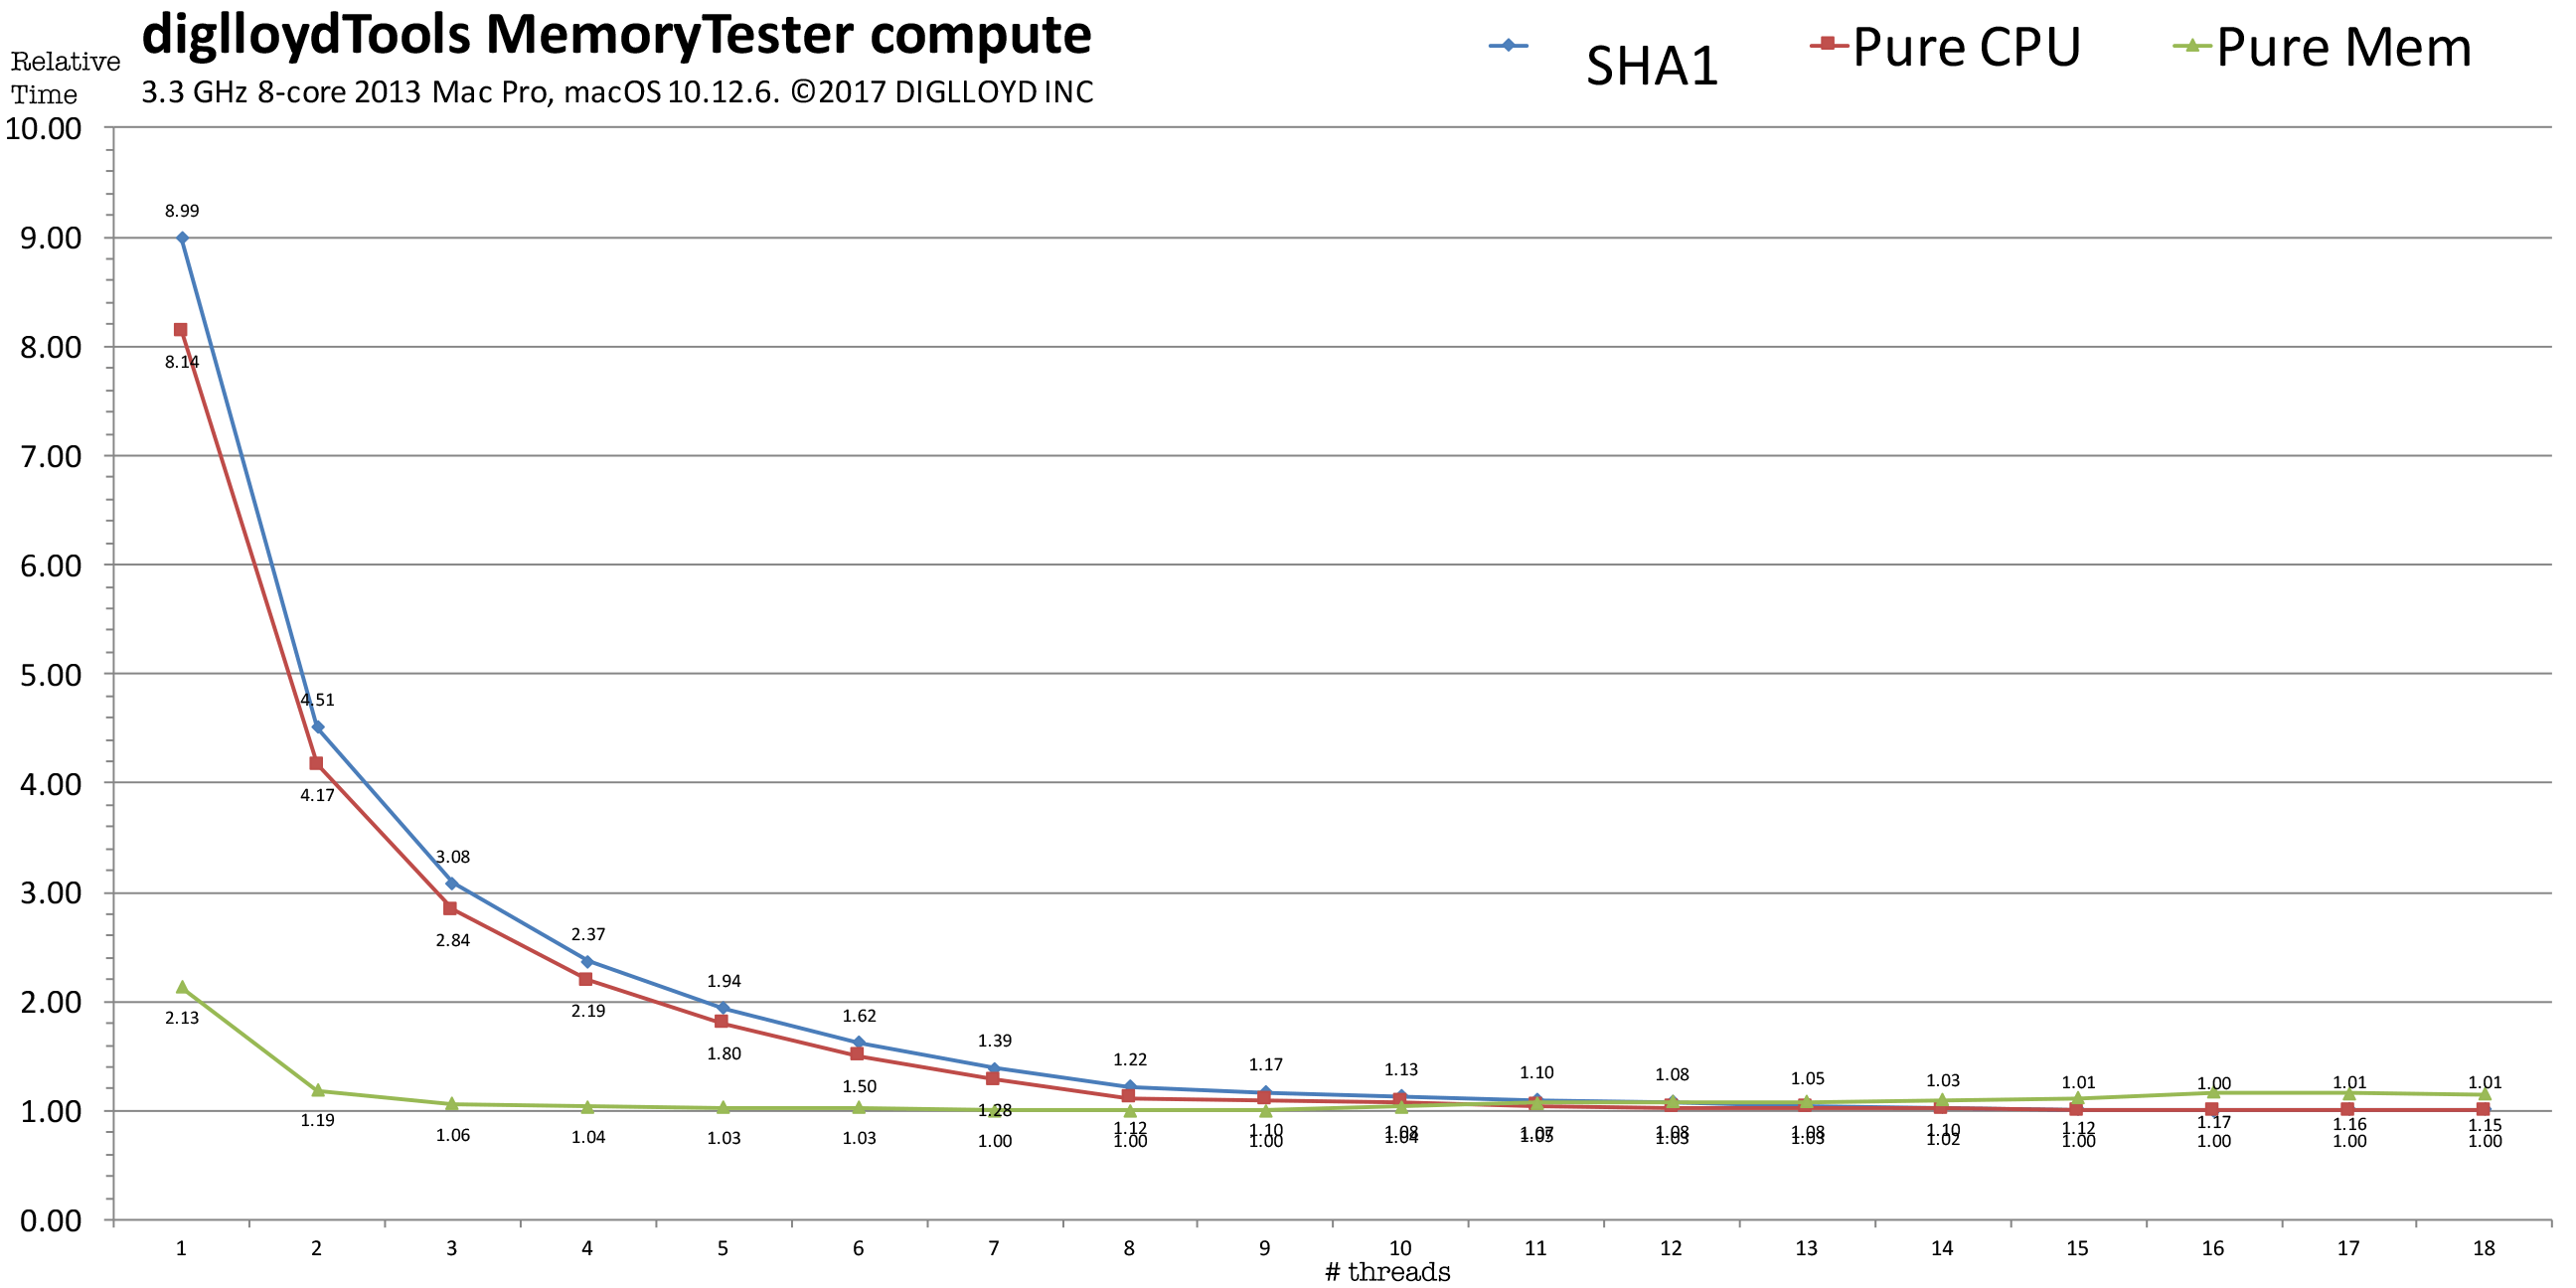
Graphing the results
The supplied spreadsheet can be used to visualize the results.
There are three benchmarks involved:
- SHA1 hash — a compute-intensive mathematical (integer) computation with moderate memory access; it is a reasonable proxy for many types of compute loads.
- Pure CPU — an integer math computation (Fibonacci series) that involves no memory access.
- Pure Memory — copying and comparing memory; completely limited by memory speed.
- Pure integer computation;
Many programs do not or cannot utilize more than a few CPU cores, or might use only a single core.
Scalability can be very good for most tasks, but there are tasks for which two cores by themselves can consume nearly all the memory bandwidth meaning that there will be poor scalability if more than two cores are contending for memory access and too little on-chip caching is available to prevent contention.
See the comments on the individual graphs that follow.
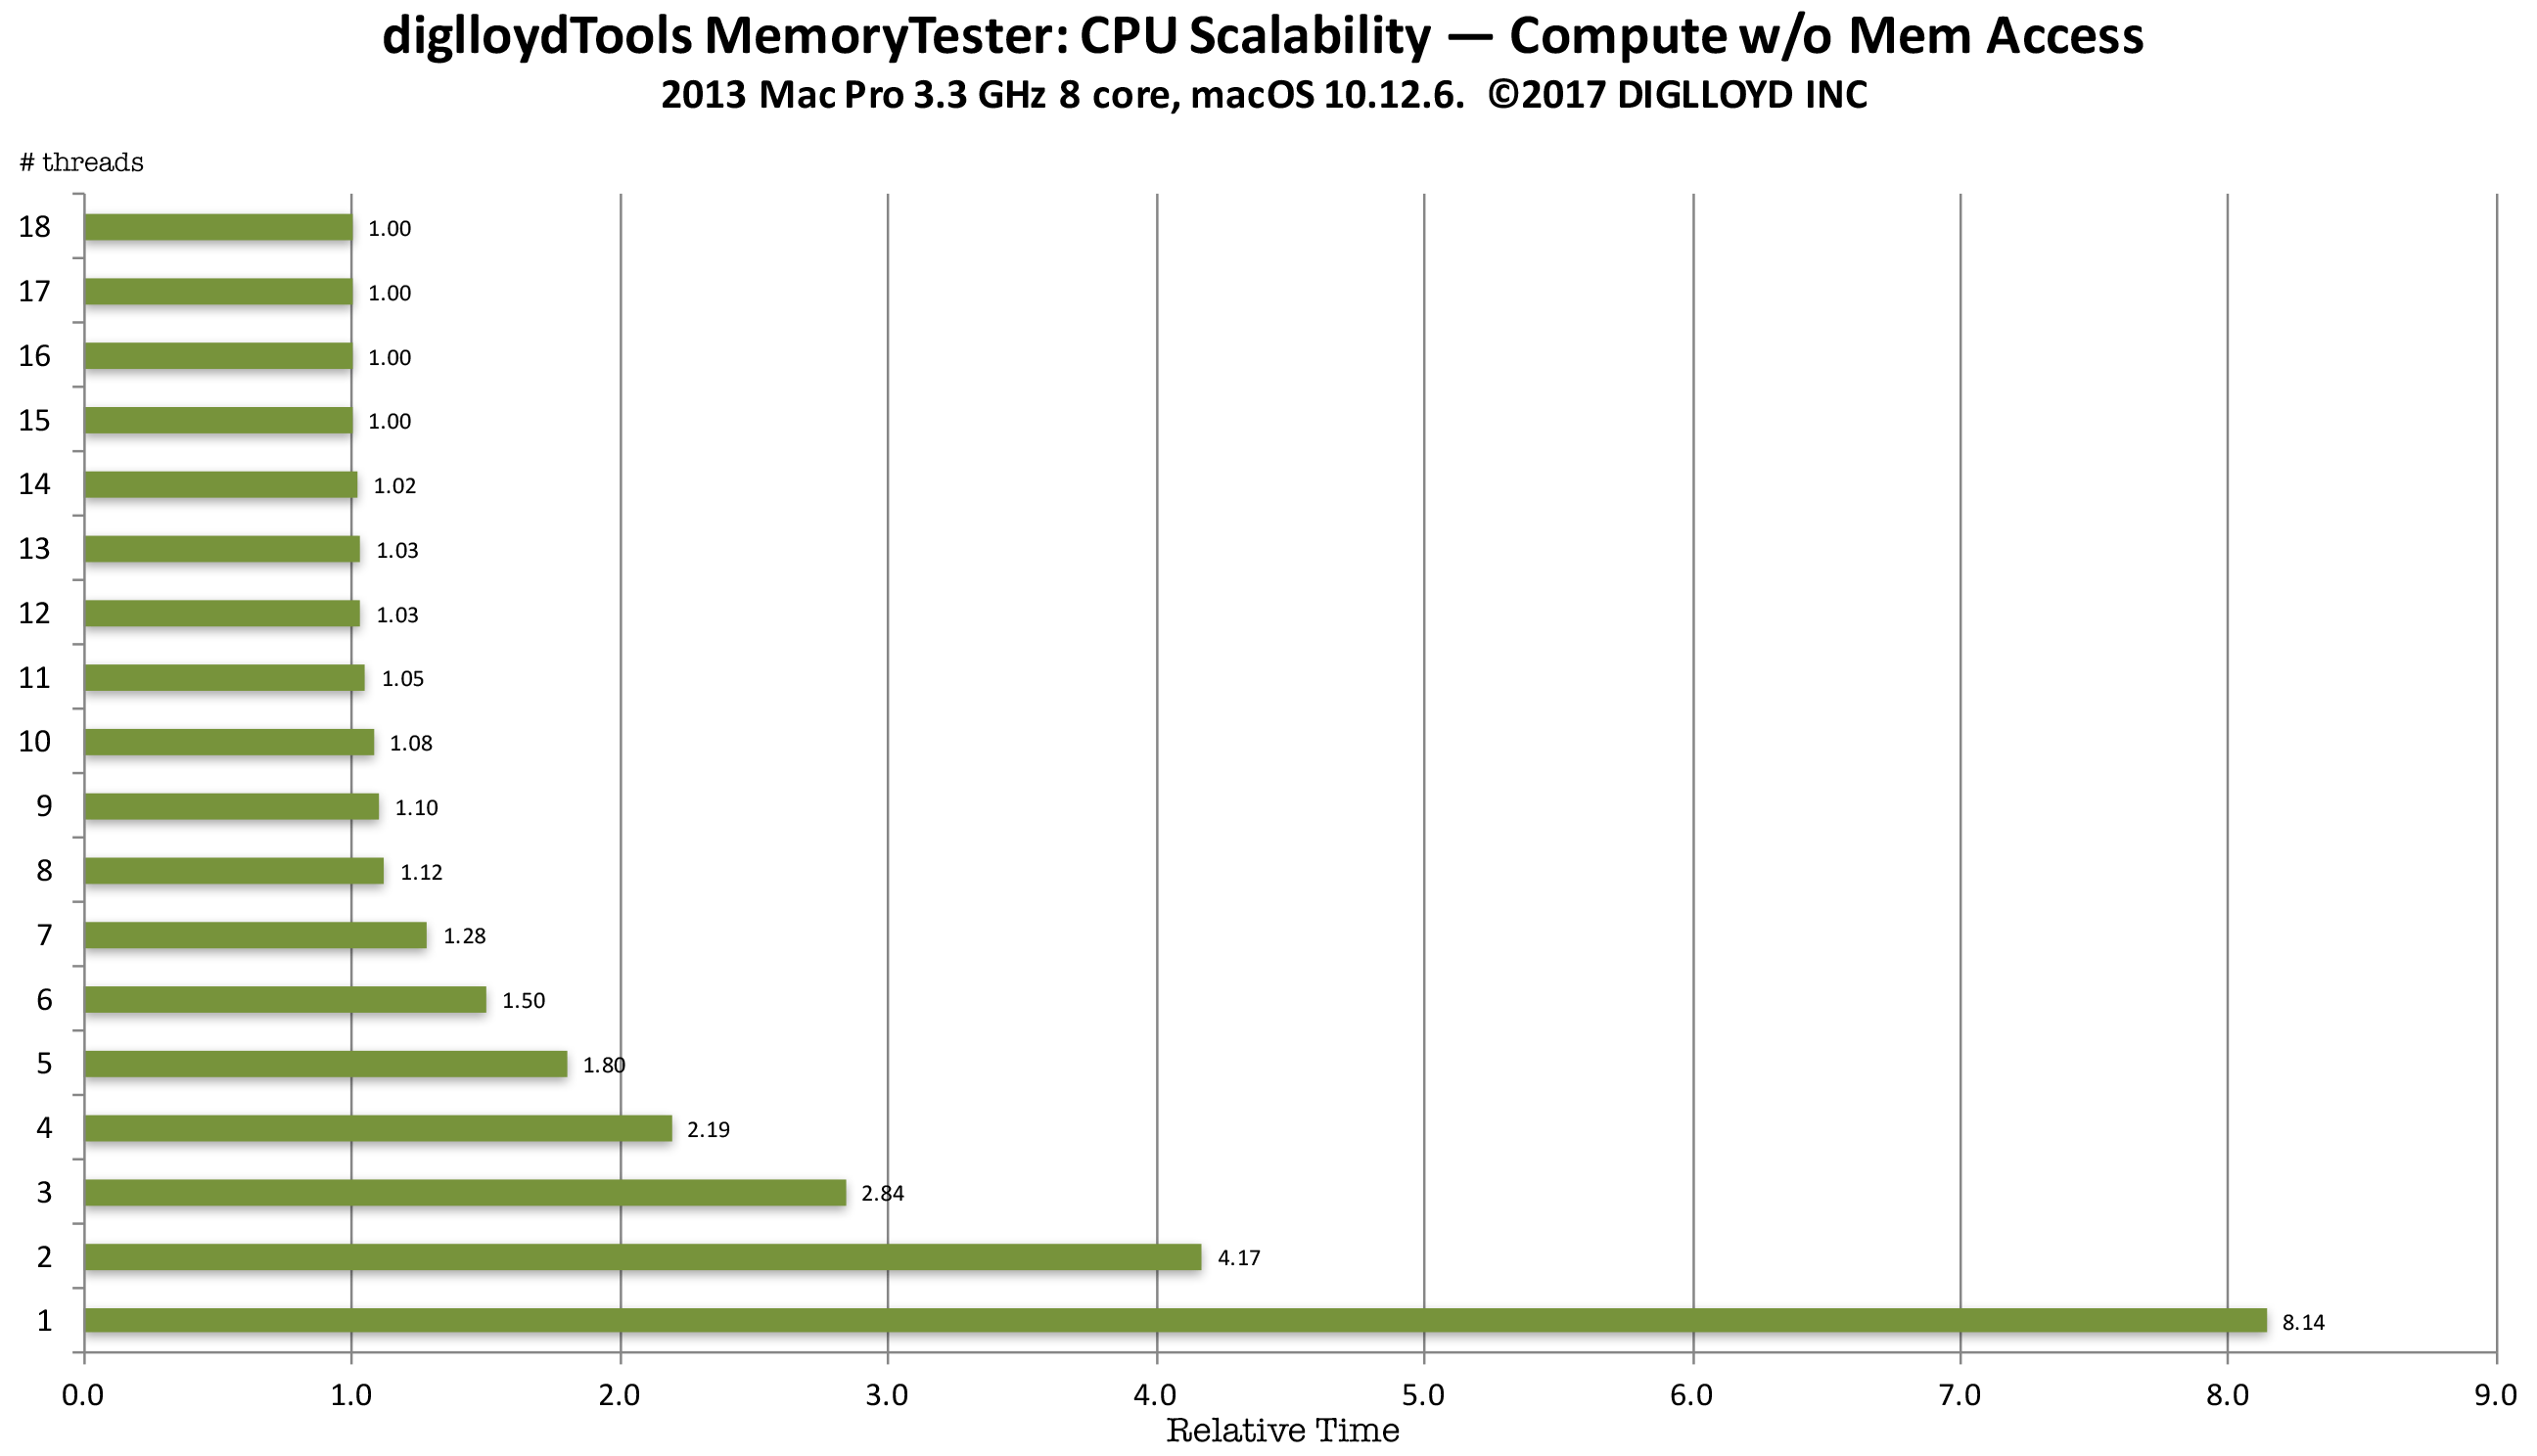
Pure CPU example
This benchmark performs no memory access at all, calculating the Fibonacci series with just a few register-based variables. This is the best case; the CPUs can run unhindered by glacially slow main memory (relative to executing instructions without memory access).
Time are normalized; a relative time of 1.0 is the minimum and fastest. Up to 16 threads were used, corresponding to the 16 virtual CPU cores of the 8-core CPU.
Scalability is good up to the number of real CPU cores: 4 CPU cores takes 1.955X times as long (2.19 / 1.12 = 1.955), with 2.0X times as long being perfect scalability. Of course, macOS runs background tasks, so we can call this perfect scalability since there is always some background activity that cannot be eliminated (so 8 CPU cores are not realy all available).
The use of hyperthreading (virtual CPU cores) has value, with 16 threads about 12% faster than 8 threads on this 8-core CPU.
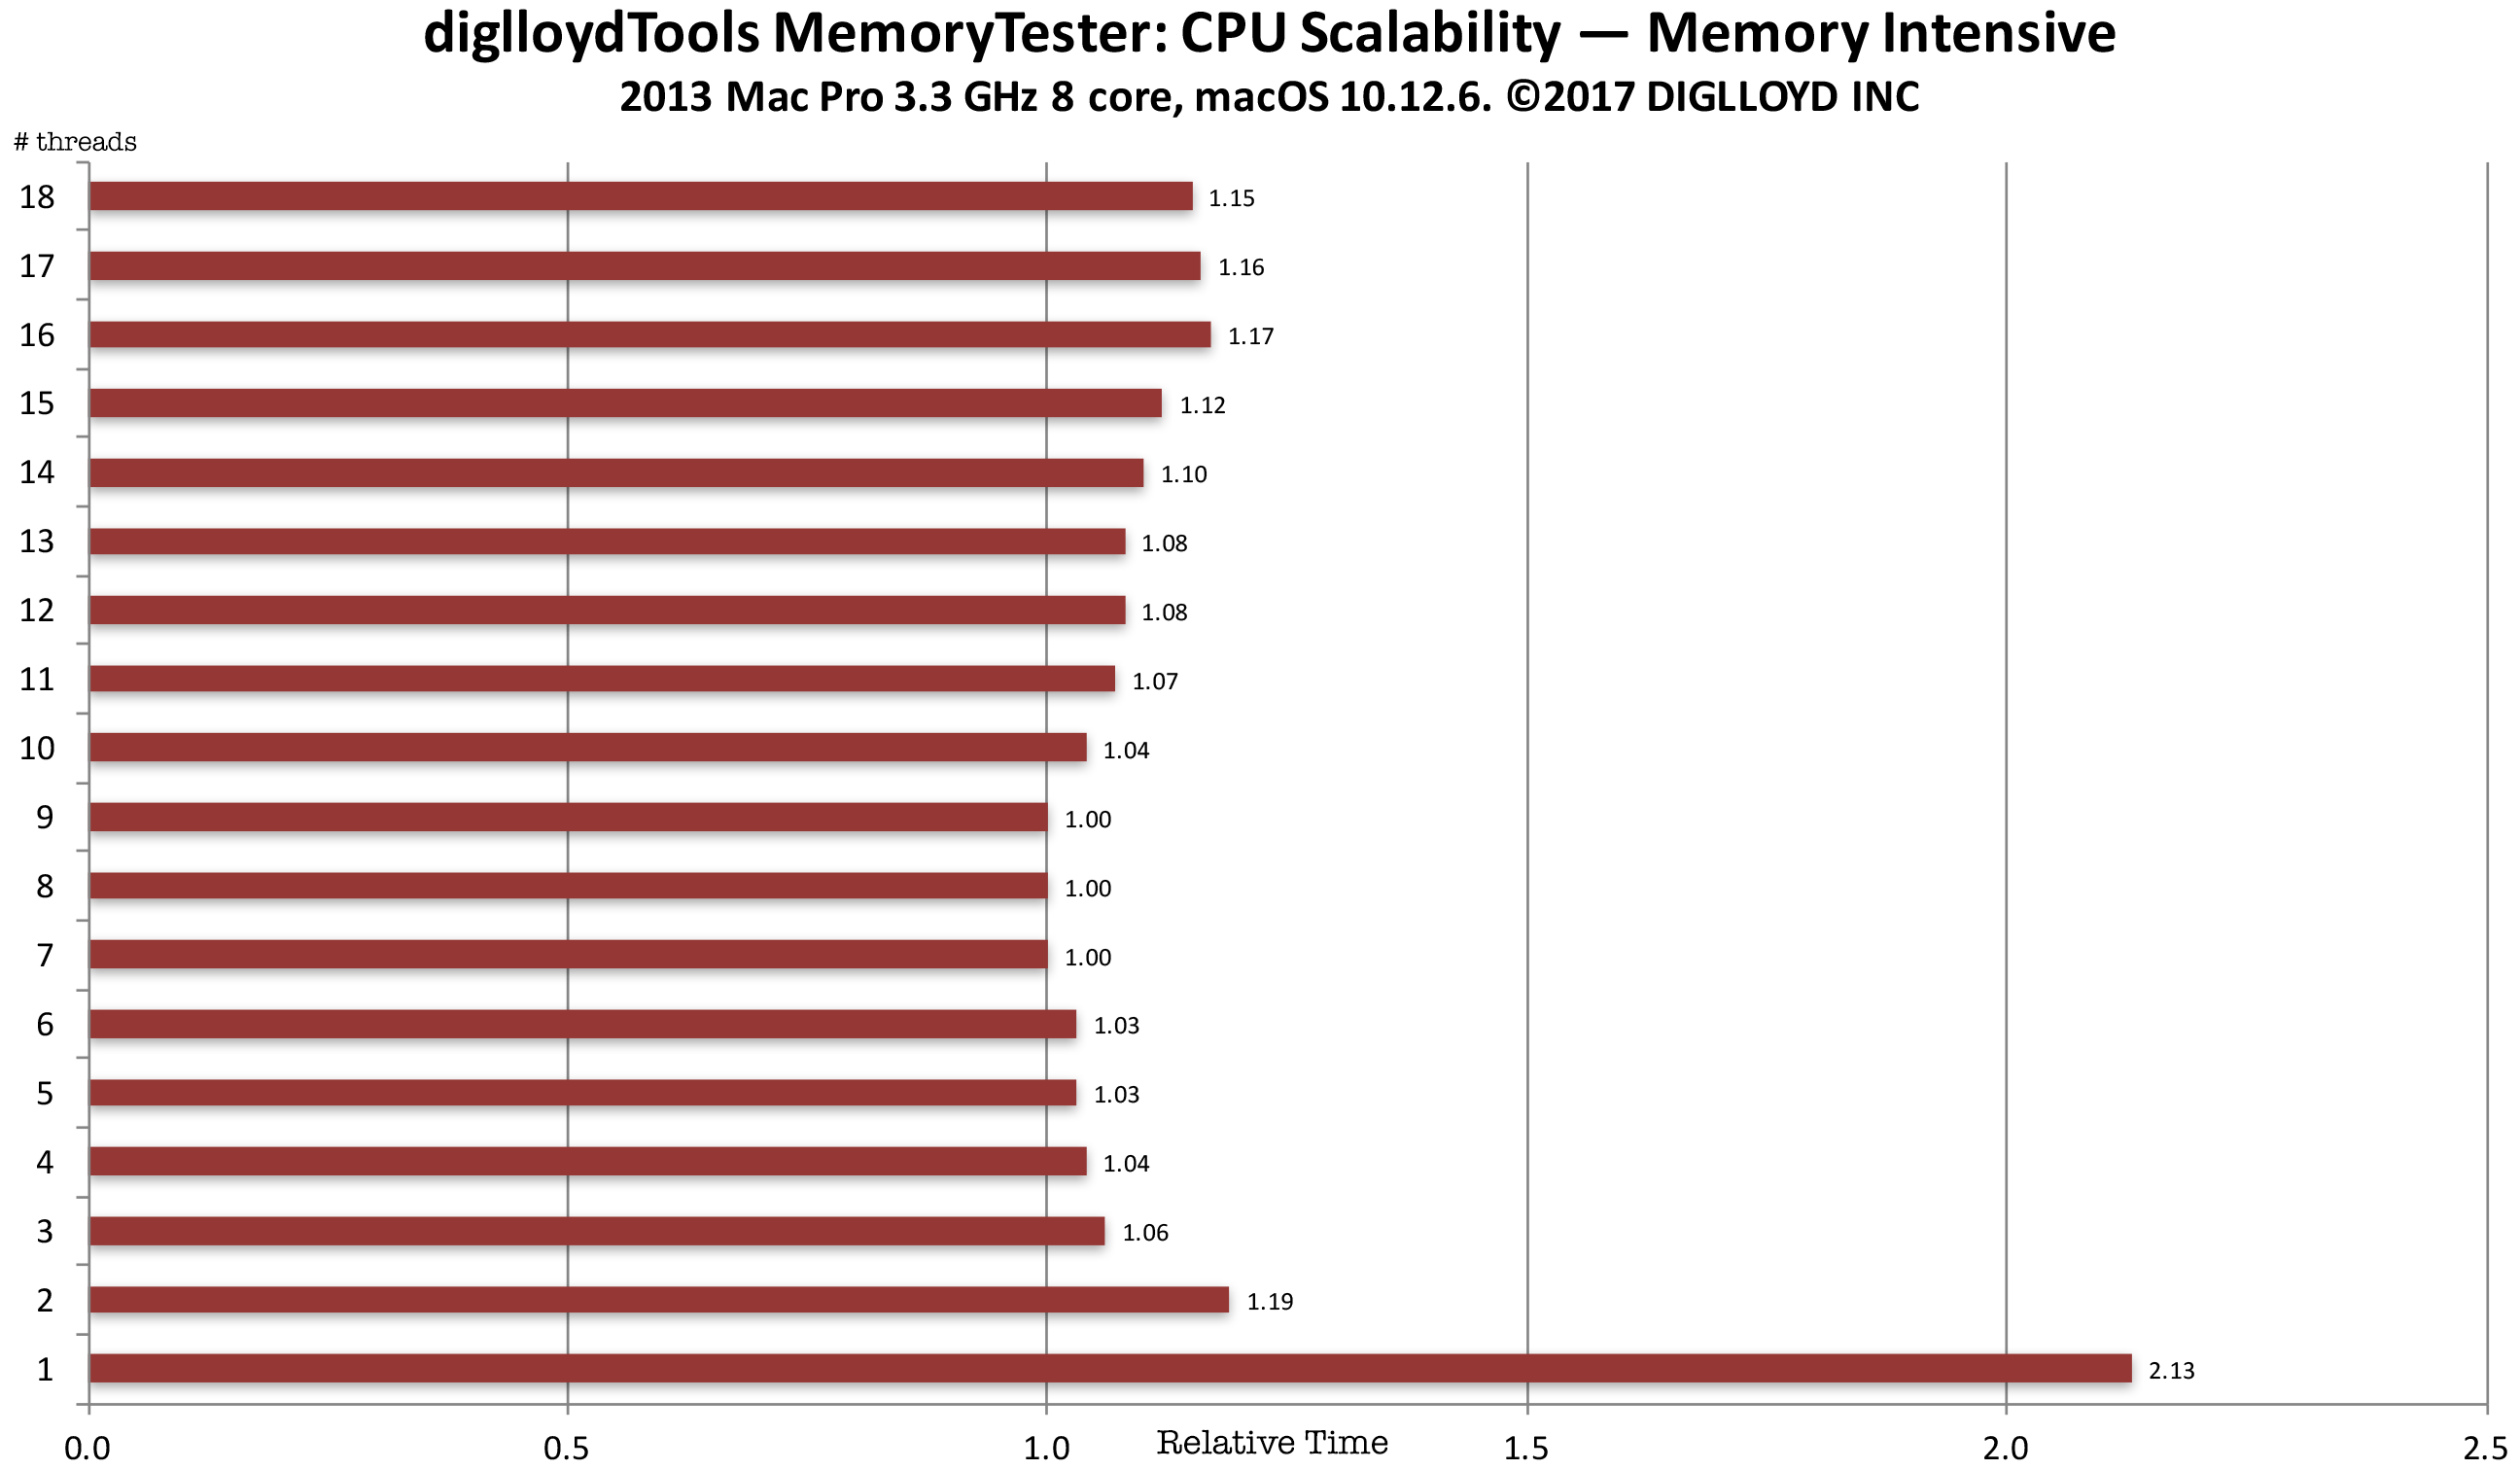
Pure memory example
This benchmark performs continual memory access by copying and comparing memory.
Time are normalized; a time of 1.0 is the minimum and fastest. Up to 16 threads were used, corresponding to the 16 virtual CPU cores of the 8-core CPU.
In the graph below, the workload consists of constant memory access—a worst case scenario. Scalability is poor, with the 4-channel memory of the 2013 Mac Pro maxed out with 3 CPU cores. The about 4% improvement seen with 7 or 8 CPU cores versus 3 CPU cores is due to overlapping instruction execution but it’s hardly a big win.
Far higher memory bandwidth would be ideal, so that that any number of threads could run unhindered by memory access speed. But main memory speed is glacially slow relative to on chip execution, which is why large on-chip caches are used—to avoid accessing main memory. This cannot be done effectively in this case with every thread utilizing disparate areas of main memory—caching breaks down.
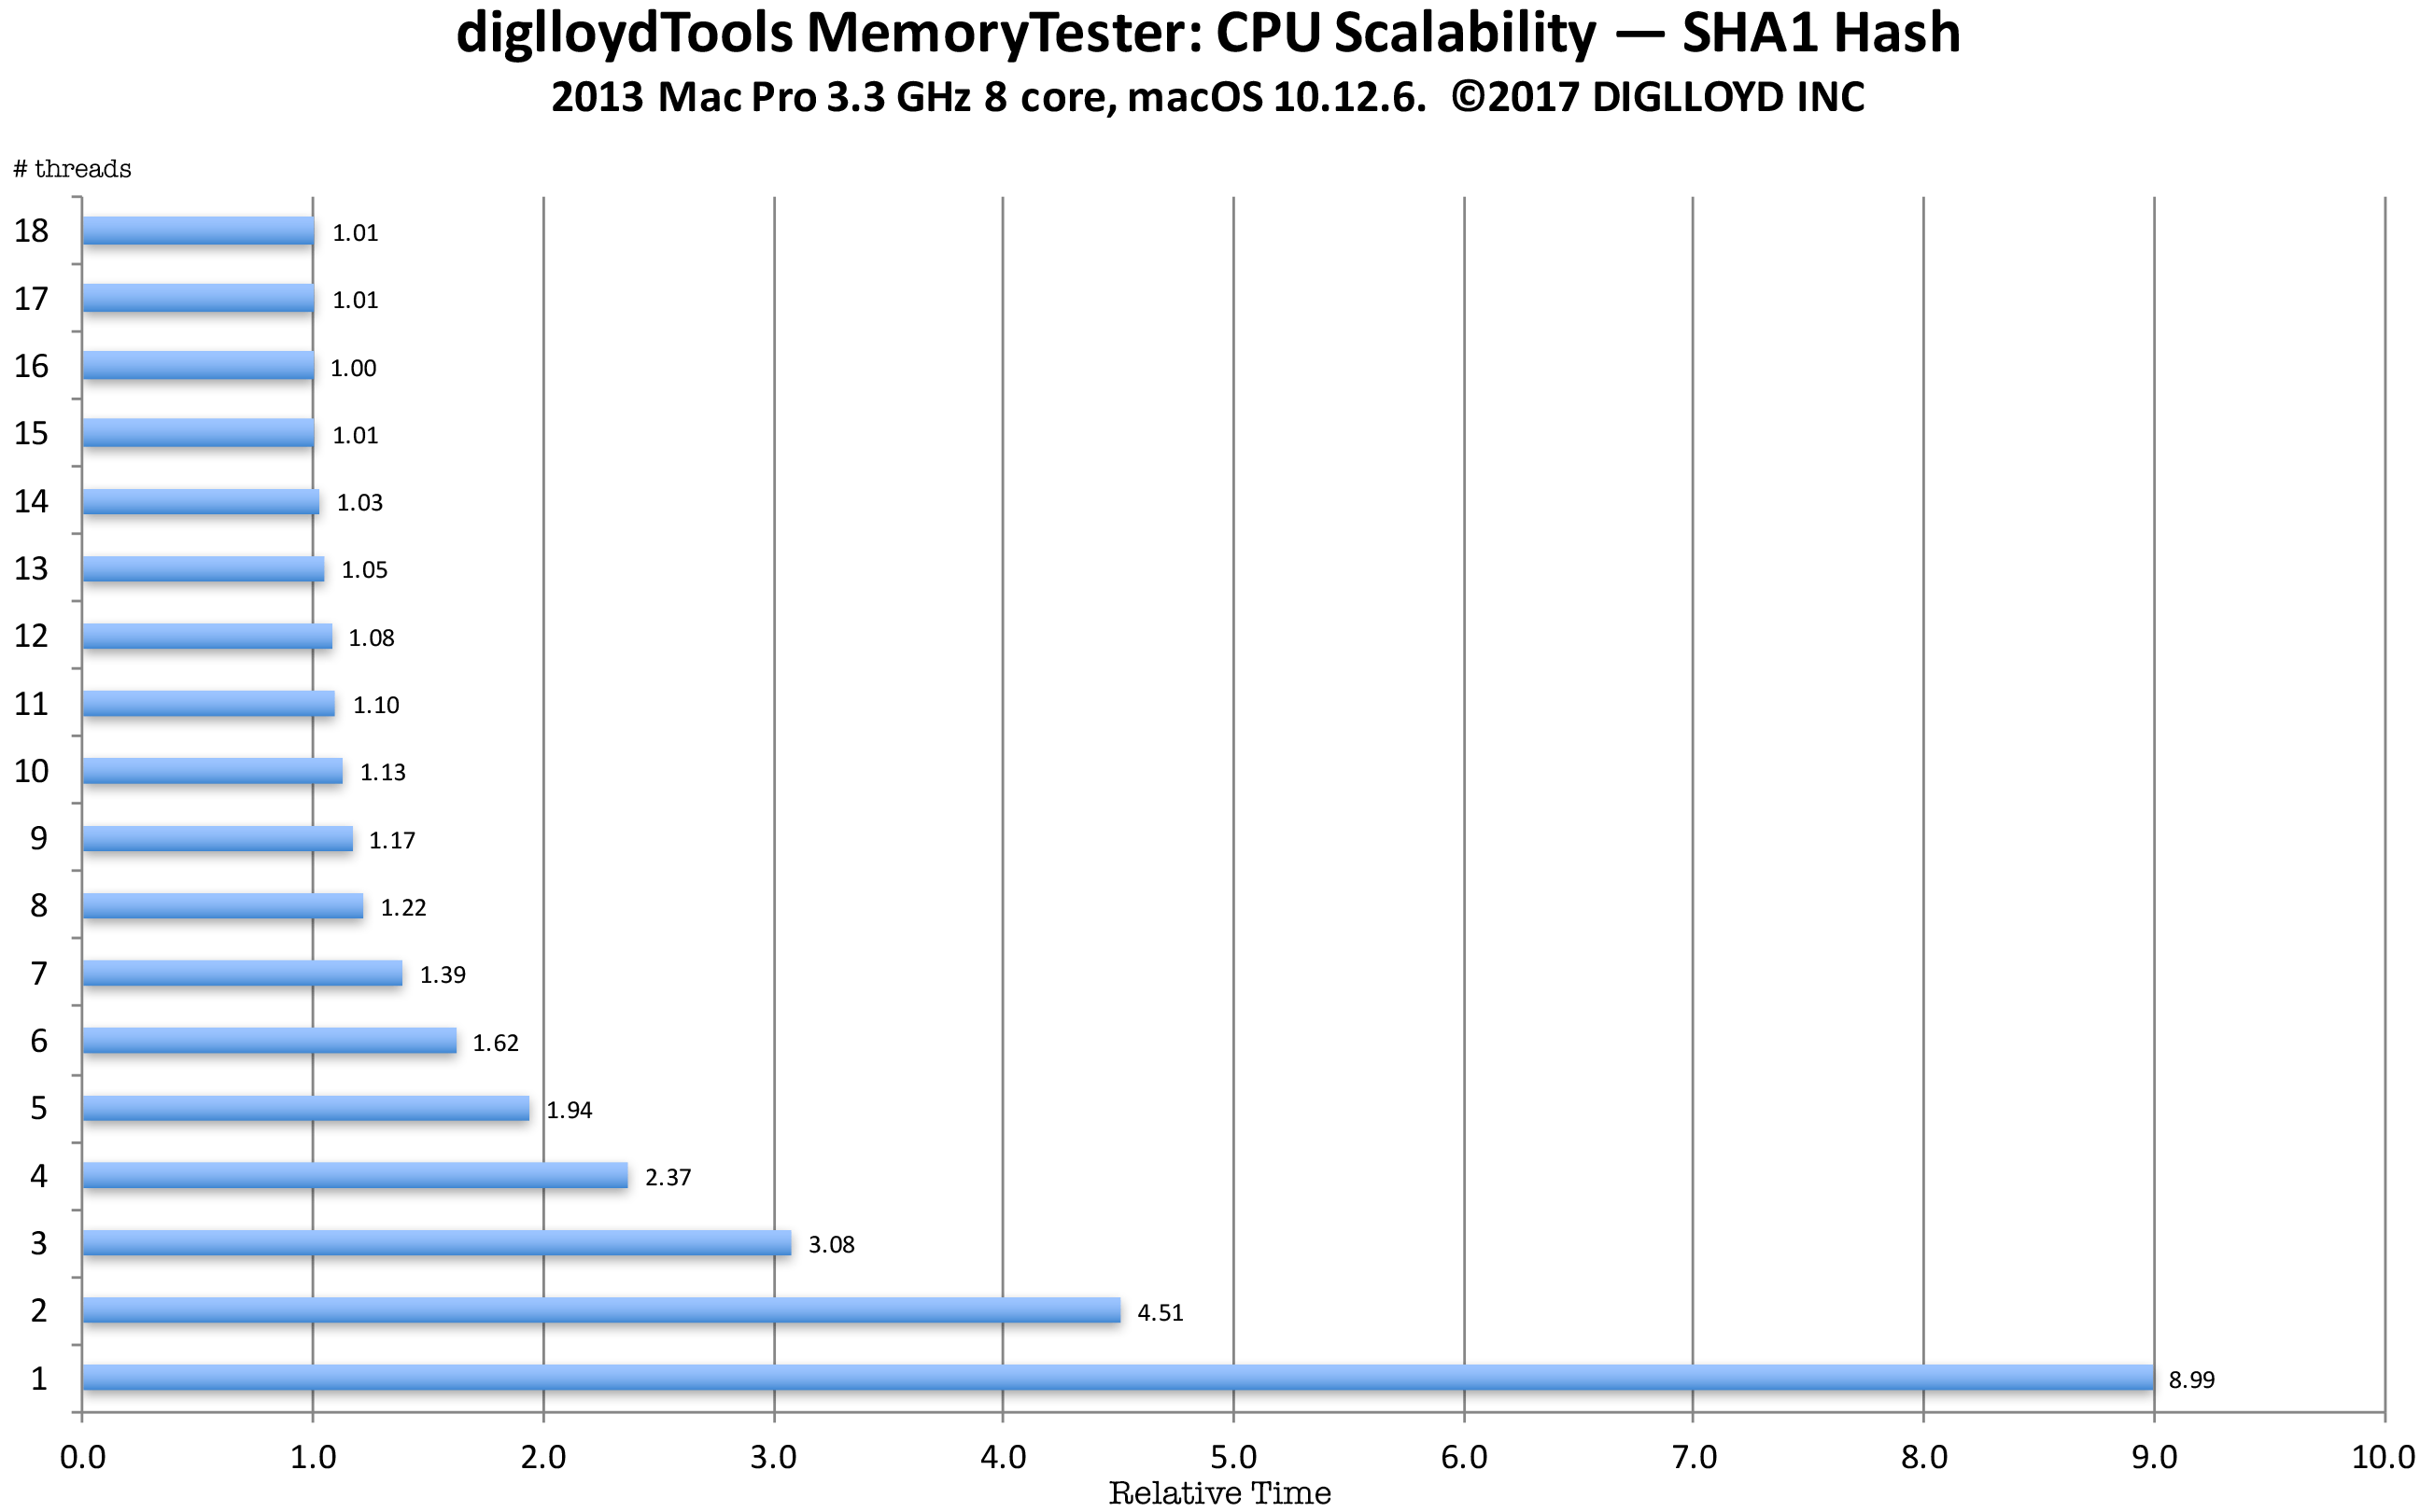
SHA1 hash example
The example below uses data from the compute command of diglloydTools MemoryTester using the 2013 Mac Pro with a 3.3 GHz 8-core CPU. This is the same hashing algorithm used by diglloydTools IntegrityChecker for file integrity checking.
The SHA1 algorithm has moderate memory access and a lot of integer computation. It is multithreading-friendly in that it does a lot of computation relative to its memory access. Different CPU threads can run independently (simultaneously) while hashing different chunks of data; the main contention points are taking a task off a queue and putting a result onto a results queue. That is a relatively easy coding challenge to tackle, so that memory access becomes the limiting factor—but since there is a lot of computation relative to memory access, even 8 CPU cores scales near perfectly. That is unless disk I/O is involved as with using diglloydTools IntegrityChecker in which case performance is usually limited to how fast the data can be read off the disk. Here in this example, there is no disk I/O whatsoever so it is as good as it gets.
Notes on the graph below
- A single thread (relative time 8.99) on the 8-core CPU takes 7.4X longer to complete the computation than 8 threads( 8.99 / 1.22= 7.4).
- Virtual CPU cores aka hyperthreading helps up to 16 threads — all the virtual cores, then begins to degrade performance.
- Using virtual CPU cores (hyperthreading) yields a 22% performance improvement (8 threads relative time 1.22 vs 16 threads relative time 1.00).
- This test is highly scalable with threads up to the number of real CPU cores: 6 threads takes 1.328 times as long (1.62/1.22 = 1.328) which is the theoretical maximum of 1.333 (8/6 = 1.333). For real-world work, such scalability is unusual. However, note that 4 threads takes 1.94X as long as 8 threads (2.37 vs 1.22).
Time are normalized; a time of 1.0 is the minimum and fastest. Up to 18 threads were used, corresponding to the 18 virtual CPU cores of the 8-core CPU.
Running MemoryTester compute
Using MemoryTester.app, choose , then click .
MemoryTester will run the test for different numbers of threads: a minimum of 8 threads, up to 50% more than the number of CPU cores. You can also (with the command line) specify any number of desired threads, up to 255 threads.
When done, you can graph the results using the supplied spreadsheet, see the results shown on this page.
Command line usage
Many variations are possible, see below for useful examples. All testing is always non-destructive (if read/write is used for volumes, a temporary file is used).
stress
    [--percent-cpu|-p <percent>]               "100%"
    [--threads|-t <num>]                       "16"
    [--memory-per-thread|-m <size[b|K|M|G]>]   "1374MB"
    [--volumes|-v <all|[,<volume-name>]*>]     "all"
    [--read-write|-w]                          "true"
    [--duration|-d <num>[S|M|H]]>]                "8H"
Drain a laptop battery as quickly as possible (insert a DVD into the DVD drive first):
mt stress --volumes all --read-only
Run a stress test for one hour:
mt stress --duration 1H
Run a stress test but using only 50% of the CPU power:
mt stress --percent-cpu 50%
Run a test for 12 hours using 1GB memory for each of 24 threads while reading and writing to/from all volumes:
mt stress --memory-per-thread 1G --volumes all --duration 12H --threads 24 --read-write
Copyright © 2008-2010 diglloyd Inc, all rights reserved